Fortescue and the Alchemy of Iron
- Tiago Q T
- Mar 16
- 14 min read


About a year ago, I wrote a post about YZJ Shipbuilding. The general idea was that while tech and anything with a vague AI reference is permanently hyped, the upstream businesses that actually keep the physical world running tend to be largely ignored by retail investors. That post turned out to be rather well timed, as YZJ’s share price has more than doubled since then.
So, in honour of that anniversary, I thought I’d look for another company in an even more basic business: commodities. It started with a VERY sophisticated process: screening Australian stocks for low PEs. Since Australia’s football team plays in the Asian confederation, that is apparently enough for this Asia-focused blog. Anyway, somewhere in that filter I ran into Fortescue, an iron ore miner.
Iron ore is the main ingredient in steel. About 98% of the iron ore mined in the world ends up being used to make steel. And steel, needless to say, is one of the pillars of the modern world: buildings, bridges, railways, ships, cars, machinery, pipelines, appliances... basically if humans built it and it is not made of wood, there is a good chance steel is involved.
To link it back to the YZJ post, choose any ship transporting metals across the seas, and your best guess for what is inside is, by far, iron. Seriously. Put together all the other industrial, precious and technology metals mined in a year and you get something around 200 million metric tonnes. Iron alone is in the order of 2.6 billion tonnes! Australia and Brazil mine more than half of that, while China consumes about half of the iron mined globally, so you can be quite sure there are a lot of ships out there right now moving iron ore from Australia and South America to China.
Intro to Fortescue

Fortescue (ASX:FMG) is relatively young by mining standards. It was founded in 2003 and has since developed iron ore mines in the Pilbara region of Western Australia, one of the richest iron ore provinces in the world. To put that age into perspective, the two giant Australian miners Rio Tinto and BHP were founded in the 1800s, while Vale, from Brazil, dates back to the 1940s. I mention these three because they form the so-called “Big Three” in iron ore mining, a label earned through their dominance in global production.
Despite being barely two decades old, Fortescue already ships around 200 million tonnes of iron ore per year, compared with roughly 300 million tonnes for each of the Big Three. That production level makes Fortescue the fourth-largest iron ore miner in the world, which has given rise to the occasional reference to a “Big Four” in the industry. With global iron ore production currently sitting around 2.5 billion tonnes, Fortescue alone accounts for roughly 8% of world supply.
The Operation
As the numbers above suggest, iron ore mining is a business of scale. Fortescue operates 3 mining hubs. These are massive operations. For example, the site of Fortescue's first mine, Cloudbreak (part of the Chichester hub), is approximately 40km long. Another example: in the Solomon site (in the eponimous hub) alone, there are more than 100 haul trucks (those gigantic ones) in operation.
That (scale) is one of the main reasons why the global market is dominated by only a handful of players. A few cents per tonne of savings when it's multiplied by hundreds of millions of tonnes equals to a lot of money.
Additionally, the main global mines are usually hundreds of kilometers from the coast. And then thousands of kilometers from the main consumer. This is also why these businesses tend to be vertically integrated. For example, Fortescue also operates a huge logistics system that includes:
760 kilometres of heavy-haul railway
bulk export terminals at Port Hedland (the world's largest bulk export port by tonnage)
a fleet of eight ore carriers
If you control the whole chain, you have a much better shot at staying low on the global cost curve.
The Revenue
Translating shipment volumes into revenue is not entirely straightforward, since the realised price depends on things like ore grade, impurities, and product type (fines, lump, concentrate, etc.). Still, it is useful to start with the broad pricing backdrop.
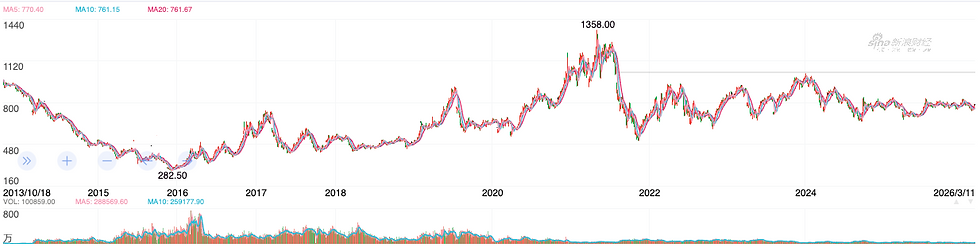
For historical reference, the chart below shows the iron ore futures price on the Dalian Commodity Exchange (DCE) in China. Prices have moved in a very wide range over the last decade, from just under CNY 300 per tonne during the 2015-early 2016 commodities crash to more than CNY 1,300 during the post-pandemic supply disruptions. More recently, prices have traded in a somewhat narrower range, roughly corresponding to US$80–140 per tonne.
As in all commodity markets, the actual price realised by producers differs from the headline benchmark. Fortescue referenced the Platts IODEX 62% Fe CFR China benchmark in its most recent FY report. In FY2025, the company reported a hematite (its most common ore produce by far) revenue realisation of 84% of this index. The discount exists because Fortescue’s ore generally contains less than 62% iron, meaning mills need to process more material to obtain the same amount of iron. In H1 FY2026, this translated into a realised hematite price of about US$90.9 per dry metric tonne (dmt).
There is one more small annoyance: shipments are usually reported in wet metric tonnes (wmt), while prices are quoted in dry metric tonnes (dmt), which strip out the natural moisture content of the ore. Since wet tonnes include some water weight, the effective revenue per shipped tonne is slightly lower than the quoted dry price.
Still, as a rough rule of thumb, if you take shipment volumes, multiply by the prevailing iron ore benchmark price, and then apply something like a 15% discount for grade and other adjustments, you get fairly close to Fortescue’s actual reported revenue. Using this back-of-the-envelope method, 100 million wet tonnes shipped corresponds to around US$8–9 billion of revenue, which is broadly consistent with the US$8.4 billion reported on 100.2 million tonnes in H1 FY2026, or the US$15.5 billion reported on 198 million tonnes in FY2025, of which 191 million tonnes were hematite and 7 million tonnes magnetite.
I made the plot below showing Fortescue’s revenue over time. The plot is in AUD instead of USD, which adds another variable, but it gets the point across.

At first glance, the trend looks clearly upward. But when you compare it to shipment volumes (see plot below), it becomes obvious that most of the variation in the last 10 years is not coming from changes in quantity shipped. It is mostly explained by iron ore prices (and AUD/USD fluctuations). Shipment volumes have been fairly stable since around 2015. FY2025 was technically a record year, but shipments were only about 20% higher than in FY2015.

So the business has not really been growing by mining much more ore, as the mines are operating not too far from capacity. It has mostly been riding the commodity cycle while keeping volumes steady.
Production costs
Now that we have some idea of the money coming in, it is time to look at the cost side.

Looking at the table above, as expected, the bulk of production costs (around 86%) sit in mining and processing. The other 14% being on the rail and port lines. Because of this concentration of costs in the mining side, the iron ore industry focuses a lot on a metric called C1 cash cost. This is basically the direct cost of mining, crushing and processing the ore. It is the most commonly used measure of how efficiently a miner can produce ore before shipping, royalties and everything else are added. If you go back to the last plot, I added this metric for all FYs since 2012.
Fortescue’s hematite C1 cost currently sits around US$18-19 per tonne, which places it among the lower-cost producers globally. During the production expansion years (early 2010's), C1 costs were much higher, above US$40 per tonne around 2012. Once the expansion phase ended and economies of scale kicked in, costs dropped sharply, reaching around US$13 per tonne in the late 2010s. I went through some of the old reports and the company also points to several operational improvements over the years, such as better mine mix, lower strip ratios, improved processing capacity, and autonomous haulage.
Costs have risen somewhat since then. Part of that is just the macro environment doing macro things: the post-COVID inflation shock and the energy price spikes after the Russian invasion of Ukraine.
Shipping and Royalties
Beyond production costs, the next bulk cost is shipping and royalties.
Shipping obviously depends on freight rates, but a good chunk of this is partly offset by the fact that Fortescue also runs its own fleet of ore carriers. In FY2025, shipping cost amounted to around US$7.7 per tonne.
Royalties are more mechanical: Fortescue pays 7.5% of revenue to the government for most of its iron ore. In FY2025 that worked out to around US$5.2 per tonne.
So if you put everything together, you get a total delivered cost in FY2025 of roughly US$31 per tonne. That is basically the core cost of getting iron ore out of the ground and into the hands of the customer. Multiply that by ~191 million tonnes, and you get close to 6 billion USD, which is also the bulk of the cost of sales you'll generally see in the financial results for the Metals division (US$b 6.528 in FY2025, see table below). The numbers don't align exactly (the roughly US$b 0.5) because Fortescue does not include operating costs (nor shipping and royalty) from Iron Bridge, the magnetite mining operation.
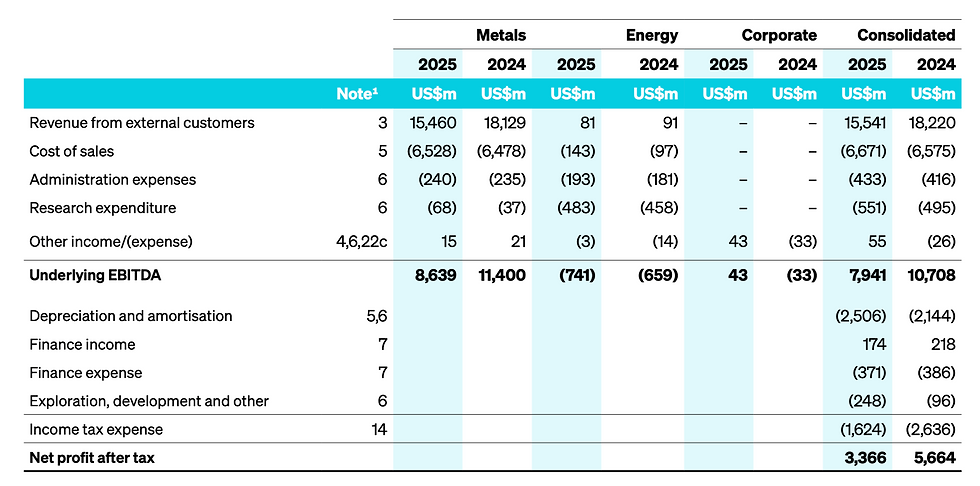
One more relevant point. Note that above I mentioned "Metals division" and that the segmented numbers in the table above also include some significant costs under "Energy". More specifically, significant research expenditure (close to half a billion USD in 2025) from that segment, which brings us to the next point.
Fortescue Energy

When you visit Fortescue's website, there is a lot of talk about decarbonisation. With these things one always needs to be a bit careful, because sometimes “decarbonisation strategy” really just means “PowerPoint with leaves on the cover”. In this case though, they do seem serious about it. Good intentions aside, there is a very clear financial incentive behind it.
Right now, the green energy segment is still tiny relative to the core mining business and generates very little revenue. It is mostly a cost centre. But management’s argument is that, over time, spending on electrification, renewable power generation, energy storage and related R&D should lower operating costs and reduce exposure to diesel prices and broader energy volatility.
In the FY26 half-year investor call, management explicitly referred to a potential US$2–4 per tonne cost impact before 2030 from diesel removal and decarbonisation. As always, multiply that by close to 200 million tonnes a year and suddenly the high CAPEX starts looking a lot less bothersome.
Of course, analysts will question this kind of spending (many questions about it in the same call). But in the grand scheme of things, it is not a make-or-break bet. Relative to EBITDA, this is still a fairly modest allocation of capital. If it works very well, great. If it works only partially, it is still unlikely to be a major blow to returns.
Also, especially now, with oil prices reacting to the de facto closure of the Strait of Hormuz, reducing diesel dependency looks like a pretty sensible hedge even if one ignores the decarbonisation angle entirely.
And anyway, over the long run, as more industries move toward zero-emission targets, selling a product that comes with low- to net-zero-emissions credentials may simply become a regulatory or commercial necessity. It does not hurt to already be moving in that direction.
On a side note, one thing I found interesting is that while mining is mentally filed under “dirty industry”, its own direct emissions are not actually that large relative to what happens downstream. Fortescue estimates its own Scope 1 and 2 emissions at roughly 3 Mt CO2-e, while the downstream processing of its ore by customers is responsible for around 270 Mt CO2-e. Steelmaking is where the real carbon furnace sits.
Balance Sheet

Another thing I liked here: the balance sheet looks very healthy. As of 31 of December 2025, net debt sits at US$1.0 billion. For a capital-intensive mining company, that is very conservative. Net debt is small relative to equity, small relative to EBITDA, and small relative to cash flow from operations.
The company generated US$3.2 billion of operating cash flow in just the first half of FY2026. Annualised EBITDA is around US$9 billion, while net interest expense in FY2025 was below US$200 million. So financing is almost unworthy of being mentioned.
Cash Cow

So, to summarise so far: costs are low relative to revenue; the cost base has been fairly stable over the last few years; there is some potential for further cost improvement through decarbonisation; and debt is low for a business this capital intensive.
That means a lot of revenue gets converted into net cash flow. And with a high payout ratio, a lot of that cash gets converted into dividends. From 2019 to 2024, the dividend yield was very often above 10%. At today’s share price just below A$20, the A$1.12 paid over the last 12 months still gives a yield of around 5–6%, and that is with the company still retaining a decent portion of earnings.
The only annoyance here is taxes. Depending on where you live, withholding taxes can eat a good chunk of those dividends. For Singapore residents, as far as I can tell, the rate is 15%. Not disastrous, but if you think of it in fee terms, a 10% dividend yield taxed at 15% is equivalent to paying 1.5% a year in friction, which starts to feel like owning an ETF with a management fee designed by a financial psychopath.
Outlook
With a decent grasp of the finances, the next question is: what does the outlook look like?
China's importance
About 90% of Fortescue’s revenue comes from sales to China. So while the company’s assets are almost entirely in Australia, its demand exposure is overwhelmingly tied to the Chinese economy.
Steel demand in China is heavily linked to construction. Roughly half of steel consumption is tied to the construction sector, so cycles in property development propagate directly into iron ore demand and pricing.
China’s property sector has been going through a structural reset for years now. Real estate used to absorb household savings, finance local governments through land sales, and drive urbanisation. At its peak, property and related activity accounted for around a quarter of the Chinese economy.
The turning point came in 2020, when Beijing introduced the so-called “three red lines” policy, restricting how much developers could borrow relative to assets, equity and cash. Which popped the bubble, leading several major developers to default, including Evergrande. Property investment has since fallen from around 12% of GDP in 2021 to roughly half that, while contracted sales among the top 100 developers dropped from 13 trillion yuan in 2020 to around 3.4 trillion yuan in 2025. Home prices have been falling for more than 30 consecutive months.
This has obviously weighed on construction activity. The plot below shows the total output value of construction in China and its year-on-year change. Growth in 2024, at about 2%, is the weakest in the series apart from the slowdown around 2015. At the same time, China’s economy now seems to be settling into a more mature regime, where around 5% GDP growth is the new normal, and probably also close to the new ceiling.

While it is possible that the worst of the property deleveraging is already behind us, Beijing’s current approach seems to focus on stabilising the real estate sector, mainly by limiting new supply and reducing excess inventory. At the same time, several forecasts point to flat or even slightly declining steel demand in China over the next few years.
So while iron ore prices today sit somewhere in the middle of the range we have seen over the past decade, the general consensus among analysts seems to point toward somewhat lower prices over the next five years.
Still about China
All that said, there is one way to increase prices even when demand is flat: remove a competitor from the playground. For example, BHP has recently had some tensions with China’s state-run iron ore buyer, including temporary restrictions on certain BHP products during contract negotiations.
Meanwhile, Fortescue seems to have been taking deliberate steps to maintain good relationships with Chinese buyers and policymakers. One example is its willingness to adopt pricing mechanisms preferred by Beijing. Fortescue and Rio Tinto have shifted part of their iron ore sales to Fastmarkets benchmarks instead of relying only on S&P Global Platts, following requests from Chinese authorities. Some transactions are also being settled in renminbi rather than U.S. dollars.
Management has also been pragmatic in building wider industrial ties with China. A lot of the equipment tied to the company’s green investments - solar panels, wind turbines, electric trucks, battery locomotives - is being sourced from Chinese manufacturers, including BYD.
Fortescue’s willingness to accommodate Chinese preferences, whether in pricing benchmarks, currency settlement, or industrial partnerships, could therefore offer a small competitive advantage if similar frictions arise again.
Oversupply
One factor that could matter a lot over the next decade is the arrival of new iron ore projects in West Africa, especially the Simandou project in Guinea, which has Rio Tinto leading one of the two consortiums involved in the project.
Simandou is often described as the largest mining project currently under construction. Once ramped up, it is expected to produce around 120 million tonnes of high-grade iron ore per year later this decade.
The ore grade is also higher, usually 64–67% Fe, compared with around 55–62% for most Pilbara ore, so it can command premium pricing and could increase competition for lower-grade producers like Fortescue.
That said, according to analysts, the impact is unlikely to be as clean and immediate as the headline numbers suggest. Simandou requires a very complex logistics chain, including a 536-kilometre railway and a trans-shipping system. And the project may actually struggle to sustain the full 120 Mtpa.
And then there is the geographic advantage. Shipping ore from West Africa to China is estimated to cost roughly three times as much as shipping from the Pilbara.
Conclusion
At the end of the day, Fortescue is a pretty simple story: a low-cost iron ore producer that converts a large share of its revenue into cash.

At a share price of around A$19–20, and with EPS of roughly A$1.90, the stock trades at a PE of about 10.4, cheaper than the other members of the Big Four. Over the last 12 months it also paid A$1.12 in dividends, which translates into a yield of roughly 5.7%. For a company with relatively low leverage and stable production, that is not a bad combination.
The flip side is that this is still a commodity business. Long-term growth is unlikely to be spectacular, and the company’s fortunes will always be tied to iron ore prices. Fortescue has largely maximised its current mining operations, so future upside will mostly come from commodity cycles rather than explosive expansion. There are some potential longer-term developments: copper mining exposure (e.g., Fortescue just completed the acquisition of Alta Copper, TSX:ATCU) and the various energy and decarbonisation initiatives, but those will remain secondary to the current iron ore mining business for a while.
Psychologically, I always feel more comfortable buying stocks when Mr. Market is in a pessimistic mood, which is not necessarily the case today given that iron ore prices sit somewhere around the middle of their range over the past decade. At the same time, Mr. Market is usually not stupid either, so waiting for the cycle to conveniently collapse just to offer a perfect entry point (and then recover right after) is probably wishful thinking.
So, despite the caveats, I still just built a position, but a small one. Just enough so I do not FOMO if this turns out to be the bottom of the cycle. But, if the cycle turns sour, I will happily add more.
Fortescue seems like a good investment, but it's always more fun to buy when there is hemoglobin on the streets.


Comments